PowerBI
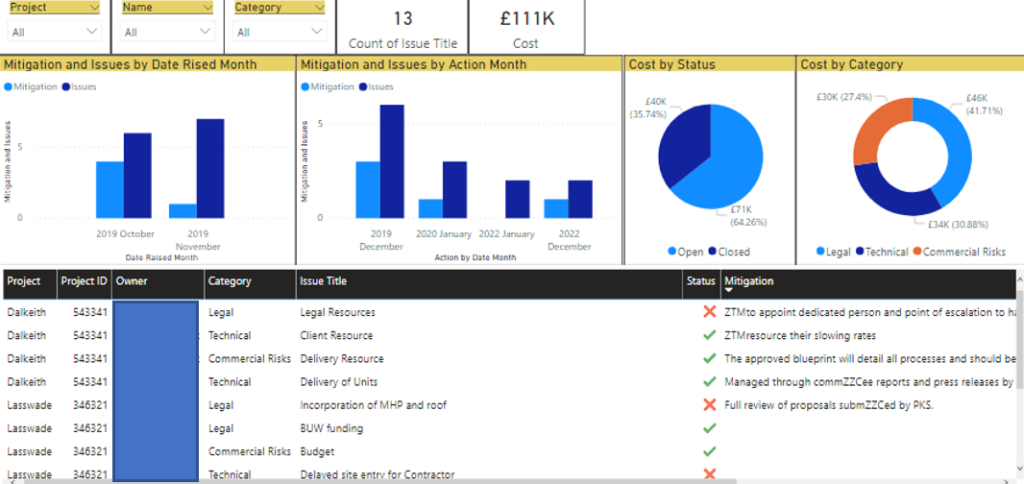
Power BI Dashboards allows you to connect your business with in real time data. Also, you could create reports from different departments of your company. Financial, HR, H&S, Operational or Sales Dashboards.


DAX and Power Query
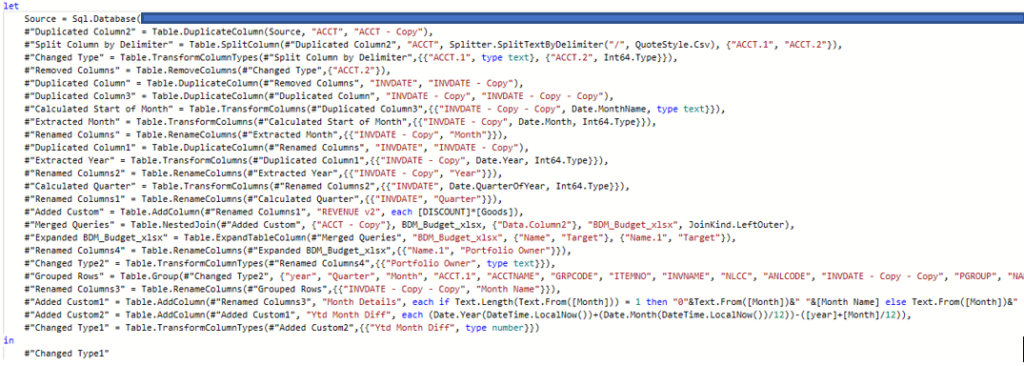
These tools are just a mix of expressions, functions, operators and mathematical formulas that are used in PowerBI for modelling and prepare the data for the visualization in the PowerBI Dashboards. Power Query is used in both Excel and PowerBI.


Power Pivot
An engine that allows the user to create a data model to craft robust tables, dashboards or reports. This tools belongs to Excel (as DAX and Power Query). Allows the user to select the data connection (for example SQL or Excel) import the data and elaborate the relationships between tables. Data sources could be SQL, Excel, Oracle and much more.